
INTRODUCTION
The Regional Housing Needs Assessment (RHNA) is a state-mandated process that estimates current and future housing needs in a city, and requires local governments to develop a “housing element” update plan to meet that need. Abundant Housing LA, a pro-housing educational and advocacy group, developed a three-part analysis of Glendale’s housing policies. First, AHLA analyzed housing production on the 5th Cycle Housing Element’s site inventory since 2014. Second, finding that very little housing production had taken place on site inventory locations, AHLA identified key reasons that help to explain this trend. Finally, AHLA created an evidence-based estimate for redevelopment in Glendale’s upcoming 6th Cycle Housing Element (2021-2029), sufficient to meet Glendale’s RHNA target.
Having realistic RHNA estimates is critical because these estimates influence the availability of homes for Glendale residents across all income categories. If housing production on site inventory parcels is significantly lower than anticipated, as occurred in the 5th Cycle, lower-income households will face rising rents, which may lead to homelessness or households leaving the region in search for affordable housing, disrupting the fabric of the community. Understanding the key reasons for low redevelopment provides an opportunity pathway for Glendale to consider when developing a plan to meet its 6th Cycle RHNA target.
During the first 5 cycles, the RHNA process lacked the administrative teeth needed to induce cities to plan for enough units to meet housing demand statewide. Local governments have continually failed to comply with RHNA via bureaucratic resistance and/or expansive low-density zoning, which constrains private developers. This planned failure is depicted well in these two ways: from 1980 to 2010, about half of the units needed to keep the state’s growth in housing costs from exceeding national growth were actually produced, and during the most recent cycle, local governments, on average, only zoned for half of their share of units needed. To remedy this state of affairs, the California Legislature empowered the Department of Housing and Community Development (HCD) to set higher housing growth targets and raise compliance standards for future housing elements. This change has already manifested itself in the RHNA targets: during the 5th cycle Glendale was asked to produce 2,017 units, while the 6th cycle will require nearly 13,400.
PART ONE: Review of 5th Cycle Site Inventory
AHLA first analyzed the parcels that were identified as sites for future housing production in Glendale’s 5th Cycle Housing Element. For this analysis, we used the 5th Cycle Housing Element’s site inventory, which includes a total of 1,246 parcels. We have cross-referenced the data from the Glendale 5th Cycle Housing Element with census tract-level data from the California State Treasurer’s 2020 TCAC/HCD Opportunity Map, as well as a dataset from UrbanFootprint containing parcel-level information about existing buildings, households, and zoning. Together, this combined dataset provides 1,177 matched parcels and a reasonable snapshot of the housing environment for the city of Glendale. Below are basic summary statistics.
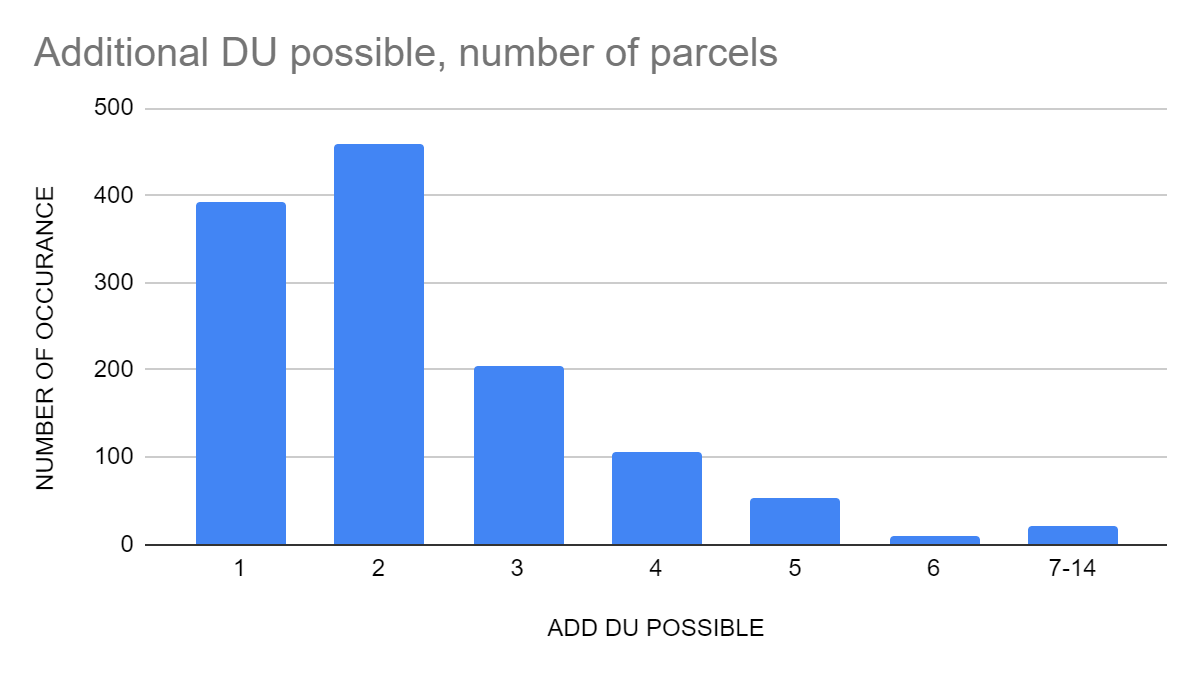
Of the matched 1,177 parcels, we find that only 4 parcels were redeveloped between 2014 (when the 5th Cycle Housing Element began) and 2018. Of the total number of parcels in the dataset, 84.7% can accommodate only 1-3 additional dwelling units under current zoning, while just 15.3% can accommodate 4 or more additional dwelling units. We also find that the total number of additional dwelling units possible in the site inventory parcels, given Glendale’s current zoning rules, is 2,862.
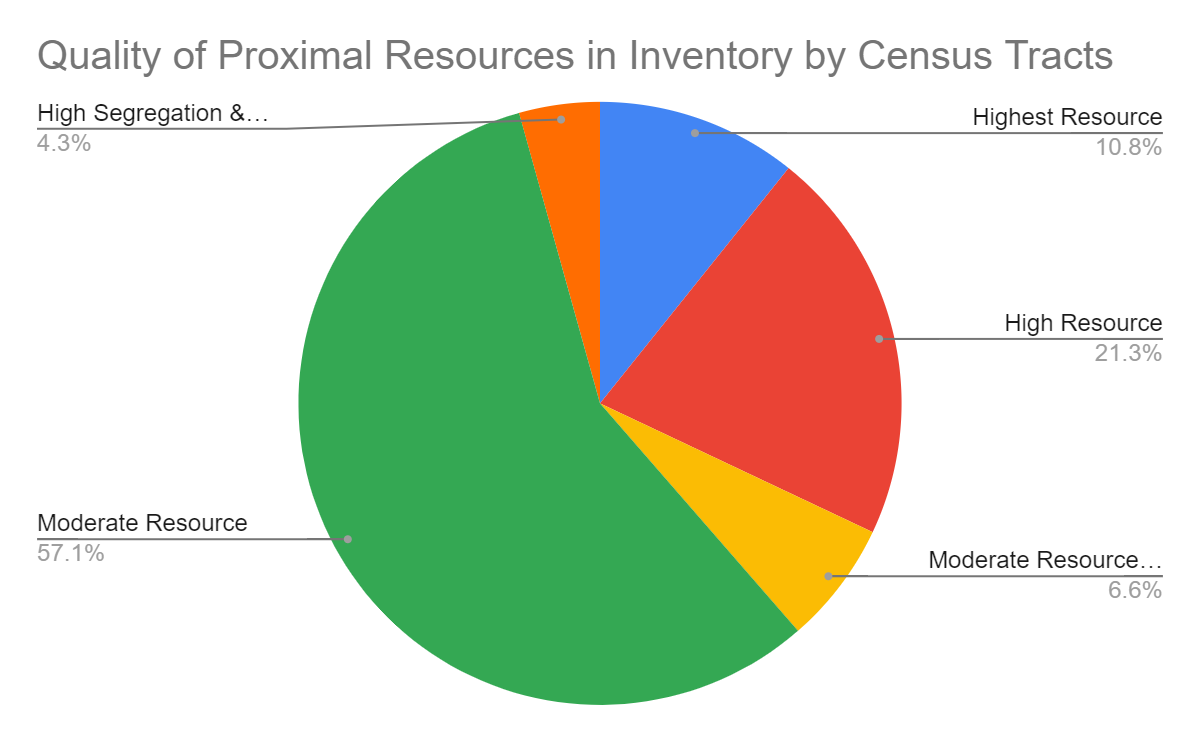
Next, we cross-referenced these parcels with the TCAC/HCD Opportunity Map at the census tract level, to identify how much of the site inventory falls into high, moderate, and low opportunity census tracts. The TCAC/HCD Opportunity Map classifies census tracts as (from highest to lowest opportunity): Highest Resource, High Resource, Moderate Resource (Rapidly Changing), Moderate Resource, and High Segregation and Poverty. We find that 64% of parcels in the site inventory fall within the “Moderate Resource” or “Moderate Resource (Rapidly Changing)” categories, while only 4% of the parcels fall within the “High Segregation & Poverty” classification. 32% of the parcels fall within the “High Resource” or “Highest Resource” category.
This sample of Glendale’s parcels portrays Glendale as a largely middle-class city. Glendale’s median annual household income ($58,657) is lower than the city of Los Angeles ($62,474) and Los Angeles County as a whole ($64,251). This comparison must be taken in context, not just because 96% of the parcels in our inventory were in moderate to highest resource census tracts, but also because of the diversity of Los Angeles’s communities, from Boyle Heights to Beverly Hills.
Thus, of the 2,862 additional dwelling units possible given this dataset, 1,634 exist within the “Moderate Resource” classification, and 114 exist within the “High Segregation & Poverty” classification. On the higher opportunity part of the spectrum, we find that 202 and 677 additional dwelling units could be built within the “Highest Resource” and “High Resource” classification, respectively. Examining dwelling unit potential is how we represent a community’s allowable room for growth. The room for growth is therefore greater (though still low) in moderately resourced neighborhoods than it is in the highest resourced neighborhoods; this disparity is significant because wealthier neighborhoods are more attractive for development. Low-density mandates in high resource communities are a significant inhibition to growth and opportunity. But growth in moderately resourced communities is also inhibited because so many of the parcels have just 1-3 extra units available to them.
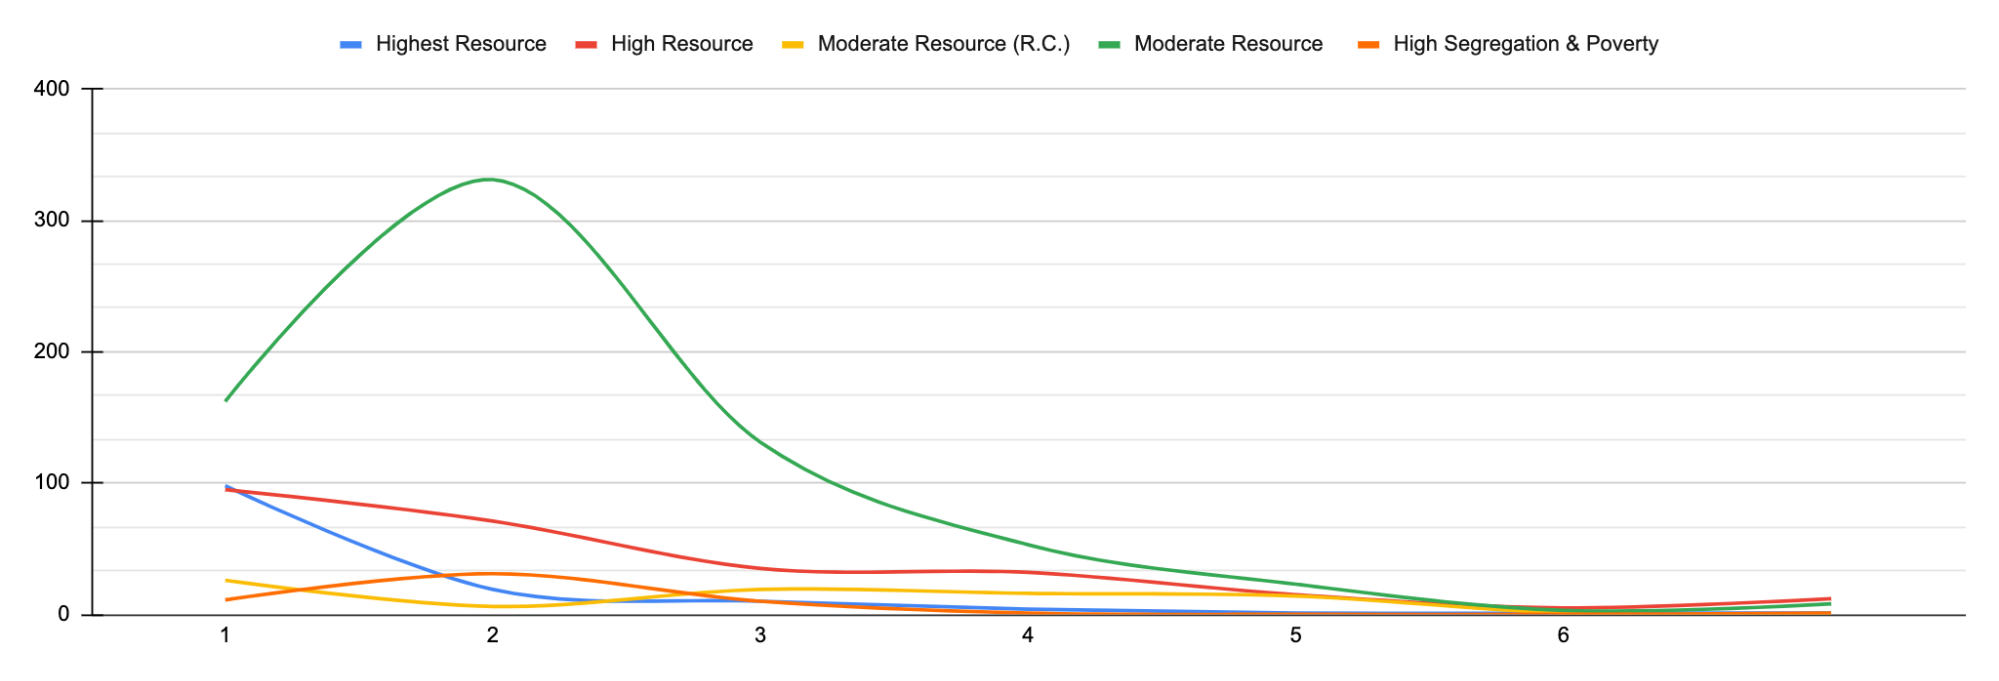
When we look at parcels with additional dwelling unit potential of 5 or more, we find nearly-equal representation within the “High Resource” (38%) and the “Moderate Resource” (40%) category. We focus on parcels with 5 or more additional units possible because these are the most likely to be redeveloped, compared to parcels with lower dwelling unit potential. To capture a more granular snapshot of the “Moderate Resource” classification, the line-chart on the following page traces each classification’s presence in each dwelling unit potential category. We find that the “Moderate Resource” classification has a disproportionately high presence among those parcels with 1, 2, 3, and 4 additional dwelling units possible. Furthermore, we see that the “Moderate Resource” classification has an overall large presence in 5 of the 7 categories for additional dwelling units possible–those categories are as follows: 1, 2, 3, 4, 5, 6, 7-14. See below for an illustration of addition dwelling unit potential by opportunity classification:
Last, in our combined dataset of 1,176 parcels, we examine land use patterns (e.g. residential, commercial, industrial) to better understand the land use type distribution within the site inventory. We find that nearly all the parcels are categorized as “residential” (97%), while all other non-residential categories make up a modest 3% of the available parcels in the dataset. Similarly, when we look more closely at the types of residential and commercial parcels in the site inventory, we find that 96% of the parcels currently have a single-family home on site, while all other land use categories represent only 4% of the parcels. This indicates that the site inventory may overrepresent single-family zoned sites, relative to other types of locations.
PART TWO: Understanding Development Trends on Site Inventory Parcels
The above analysis of the 5th Cycle site inventory demonstrates that very few of the parcels that were identified as likely sites for future housing production actually generated more housing during the following years. Based on this trend, especially when placed against the backdrop of Glendale’s expansive R1 (Low Density) Zones, we hypothesize that rezoning to allow increased density is necessary for Glendale to reach its 6th Cycle RHNA housing target, especially since the 6th Cycle target (13,400 homes) is far higher than in past cycles.
The fundamental question to be posed is why it is that only four parcels on the site inventory were redeveloped between 2014 and 2018. Glendale is perceived to be a safe and desirable community. The last decade featured the longest economic expansion in U.S. history, and Glendale is a jobs hub for the entertainment industry. Many favorable conditions for housing production existed, but these conditions were not acted upon in the site inventory locations because restrictive zoning limited the opportunities for redevelopment at these locations.
Most of the 2,800 additional units possible in the site inventory should not be considered viable for redevelopment, because most property owners are unlikely to redevelop a property in pursuit of future profits from just one or two additional units. The true dwelling unit growth ceiling from the inventory is not 2,862–rather, it is closer to 1,554 or below, which is the figure reached after subtracting the parcels with just one or two additional units possible.
Our understanding of the capacity ceiling of 1,554 additional units must be further tempered if it is to be a useful heuristic for projections, because even parcels that do get redeveloped may not be redeveloped to full current zoning capacity. Knowing that some property owners will have greater capital flexibility than others, the city’s zoning should give such owners more room to grow for the sake of compensating for those that choose not to redevelop.
Turning to equity and political concerns, it may seem sufficient that most of the parcels with 5 or more additional units possible are found in moderate income census tracts, rather than the few high segregation tracts. But this is an unsustainable situation because of how little room for growth there is in the two highest categories of opportunity tracts. As far as the RHNA is concerned, this matters because recent research confirms that upzoning in higher-priced neighborhoods has a much higher production payoff because developers are enticed to build where they can command higher rents. These findings inform our recommendation to upzone along transit and commercial corridors, even if those parcels are currently in R1 and R2 zones.
Planning for the next RHNA cycle presents a window of opportunity for a better approach to housing policy, one that would relieve the region’s housing shortage while supporting more economically and racially integrated neighborhoods, which would foster positive, multi-generational effects.
It’s intuitive that any rising lower-to-middle income family that moves into a low-poverty neighborhood is likely to see their lifetime trajectories in many economic, physical, and mental health categories improve. Yet it’s worth repeating because these low-poverty neighborhoods will remain exclusive enclaves unless rezoned to allow more housing opportunities, and because one’s residency influences educational and economic prospects. One body of data that has been utilized by many researchers is from the Moving to Opportunity for Fair Housing (MTO) experimental program facilitated by the Department of Housing and Urban Development (HUD). In this study, households given the chance to move from a high-poverty to a low-poverty neighborhood, through availability of Housing Choice Vouchers and housing counseling, experienced better physical and mental health for adults. Children that were under the age of 13 when their family moved to a lower-poverty neighborhood had a 31% higher average annual income in their mid-twenties, compared to children whose families did not move.
Opponents of upzoning can dig into the literature and trivialize the positive effects of neighborhood migration, or doubt the correlations, or selectively highlight instances where the evidence for a positive outcome is mixed, or oppose a potential stabilization or drop in housing costs. But where there are policy tradeoffs to consider, expanding opportunity for those more in need should take precedence, especially given the severity of California’s housing crisis.
Part Three: Zoning Recommendations and Rationale
Before explaining our zoning recommendations and some of the research that underpins our recommendations, we should briefly address some foundational points which emphasize the need for rezoned capacity to significantly exceed the RHNA target, and the need to conservatively estimate the likelihood of that new capacity being redeveloped. The economic cycle, uncertainty in market conditions, the current usage of land parcels, and land use regulations all influence the extent to which rezoned parcels are built to their theoretical maximum capacity. The uniqueness of this recession and political climate makes it difficult to predict when or how a sustained economic recovery will occur, which will affect the trajectory of future housing development.
Second, while recent legislation streamlining the process to build an Accessory Dwelling Unit (ADU) incentivizes homeowners to generate this new source of income, we cannot confidently expect cities to relieve their housing shortages through ADU development alone. We can predict the future behavior of homeowners based on their prior behavior: while some will take on the risk and expense of building an ADU, most will not; notice how few single-family homes in the site inventory redeveloped into duplexes and triplexes during the 5th cycle.
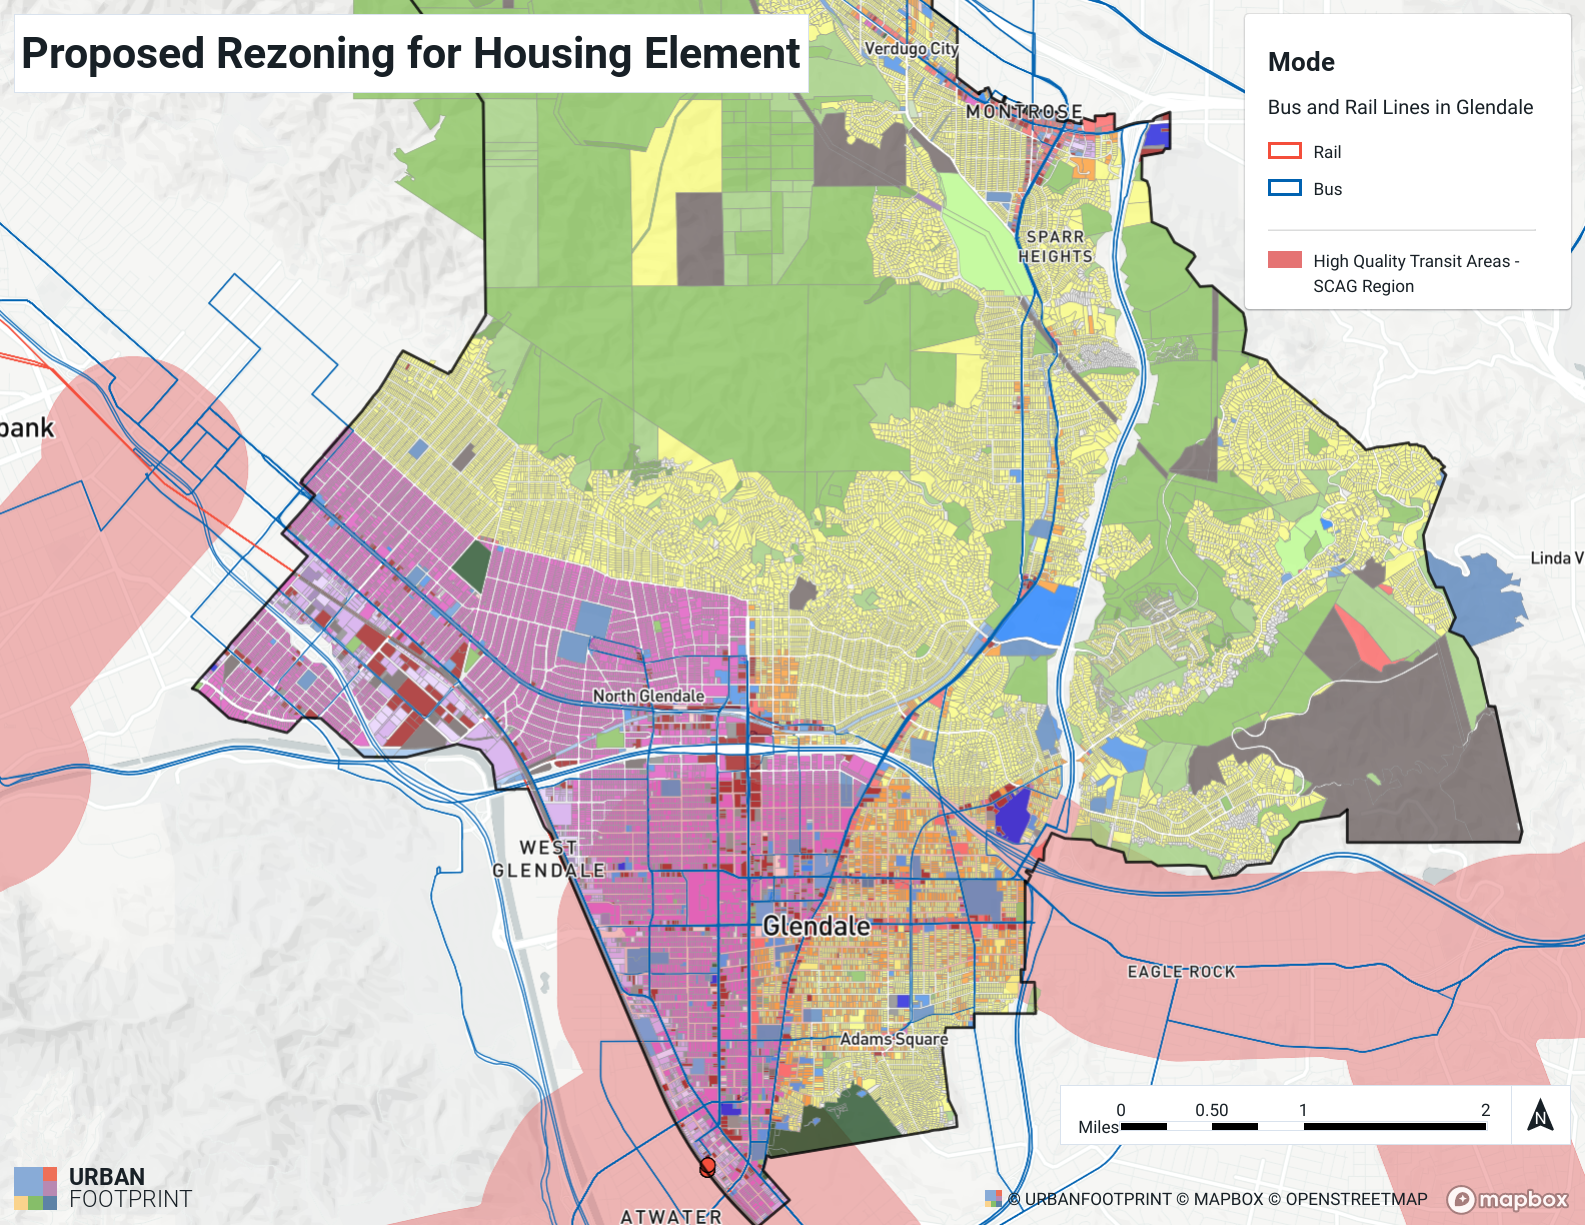
Rezoning provides an opportunity for Glendale to create the conditions in which the RHNA target of 13,400 new homes can be achieved. First, we first propose the following area in blue to be rezoned (high-quality transit areas appear in red; bus routes are blue lines; Metrolink rail is a red line):
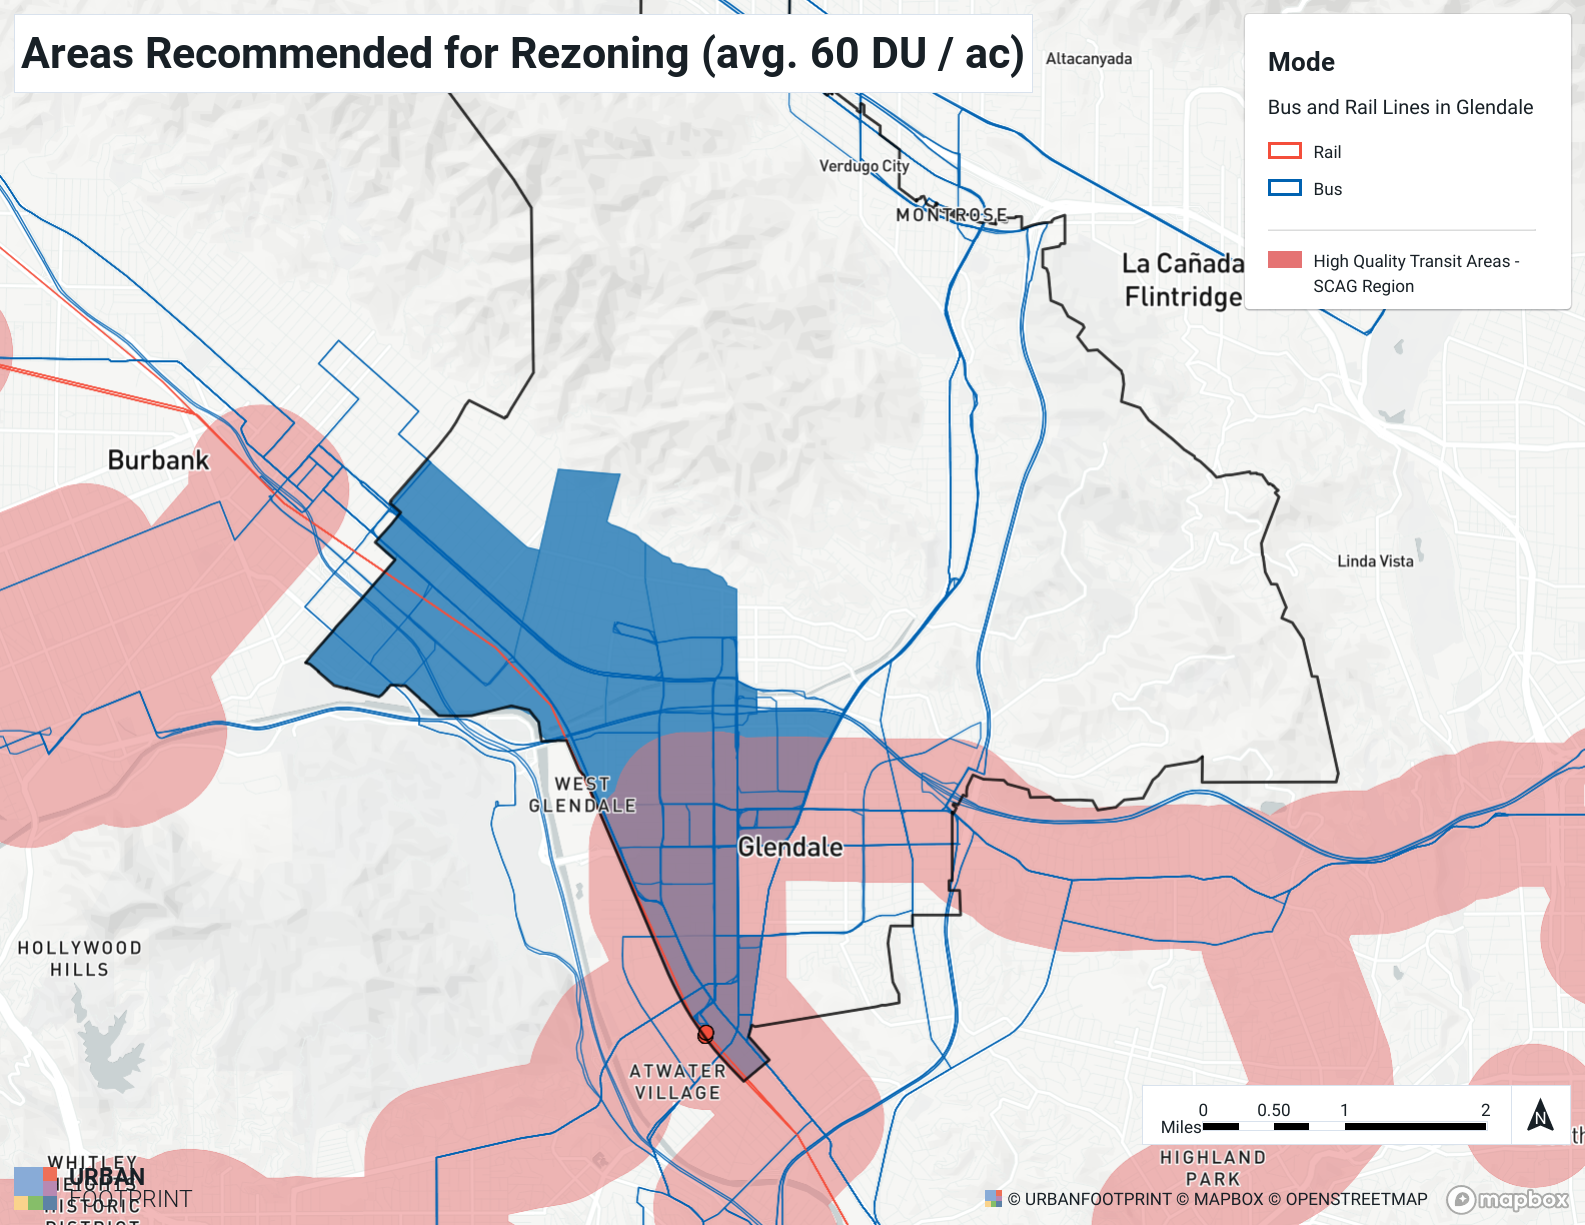
The above map shows a portion of the city of Glendale in solid blue, which contain significant multifamily and commercial development, and are likely to have a high potential for new housing production if rezoned. AHLA recommends rezoning all residential, mixed-use, and retail parcels in the area shown in solid blue to allow multifamily development at an average density of 60 dwelling units per acre, and rezoning the remaining single family zoned parcels to allow by-right triplexes.
The proposed rezoning is illustrated in the following graphic:
Should Glendale implement a rezoning strategy where multifamily development at an average density of 60 dwelling units per acre is allowed, we estimate that 10,300-15,500 homes would be built in the upzoned areas, with 13,000 new homes by 2030 as the mid-range estimate.
Should Glendale permit by-right triplexes on all remaining single family zoned parcels citywide, at an average density of 17 dwelling units per acre, we estimate that 3,000-8,700 new homes would be built as a result of the policy change, with 5,800 new homes by 2030 as the mid-range estimate.
Combined Impact of Rezoning
In a scenario where Glendale achieves the mid-range percentages for new housing production under the combined rezoning strategy, roughly 18,800 additional homes would be built in Glendale by the end of the 6th Cycle, which exceeds the RHNA target of 13,400 new homes. It makes sense for cities to “overzone” in their housing element updates; the California Department of Housing and Community Development (HCD) recommends sufficient rezoning to exceed the RHNA allocation by 15-30%. The AHLA-recommended rezoning plan would thus amount to 140% of the RHNA target, more than meeting HCD’s guidelines.
A More Affordable and Housing-Rich Glendale for 2030
So what would Glendale look like if its RHNA targets are achieved using these recommendations? With an average distribution of 60 DU/acre (blue area), these neighborhoods will see an increase in apartment complexes with three or more stories; some developers will even wish to fully capitalize on the new capacity of 60 or more units per acre, which could allow them to build to roughly 6-8 stories where they previously could not. The implications of this growth are exciting. It could mean fewer people driving from San Bernardino County or elsewhere to get to work in Glendale, and more riders paying into Glendale bus routes. It could mean even more local shopping, more sales tax revenue, and more property tax revenue. By fulfilling its RHNA allocation, Glendale would demonstrate its commitment to a region where all local economies are interconnected, not to mention avoiding lawsuits from the state or activist organizations. Most importantly, the life enjoyed by current residents can be enjoyed by many more, and the lives of those that currently reside here will be enriched by new neighbors.
The city of Glendale has the unique opportunity to set the standard for other California cities on how to meet and exceed their RHNA target. This analysis may help city officials understand what we believe to be the key reasons for the 5th Cycle failure, while also presenting a pathway to future RHNA success. Virtually all current and future residents will benefit from a rezoned Glendale with a higher concentration of dwelling units, but it is perhaps those that are most vulnerable that will benefit the most.


