In Los Angeles County, the competition for “most anti-housing city government” is fierce.
Beverly Hills’ former mayor believes that legalizing apartment buildings in his city would somehow worsen climate change, and frequently uses social media to deride advocates of more housing near transit as Wall Street shills. La Cañada Flintridge, a wealthy San Gabriel Valley suburb, approved a housing plan in 2013 that was deliberately designed to make apartment construction too expensive to pursue. Both Lancaster and Palmdale were found to have harassed Black and Latino renters through discriminatory enforcement of housing laws. Torrance is one of 38 cities in the county that permitted zero housing units that are affordable to lower-income households between 2014 and 2019.
Of course, each of L.A. County’s 88 cities suffer from NIMBYism and ill-designed, often discriminatory, housing policy to varying degrees. But to actually measure and compare cities across L.A. County on their hostility (or openness) to housing, we’d have to somehow quantify the strictness of their local land use and zoning policies, in a way that’s consistent across cities. We’d also need a methodology that’s more nuanced than simply comparing each city’s rate of housing growth, since housing growth is influenced by many factors, like overall demand for housing, land availability, and job growth.
Fortunately, our friends Professor Chris Elmendorf of the University of California, Davis and Professor Paavo Monkkonen of UCLA have a solution. Their recent paper “Superintending Local Constraints on Housing Development”, with co-authors Eric Biber and Moira O’Neill, argues that “that local governments in expensive areas have substantial governmental constraints if their rank by housing price (rent) exceeds their rank by rate of housing production.” This makes sense: cities with high rents should also have high housing growth, because high rents signify high demand for housing, and builders should respond to high demand by building housing. So cities that have high rents and low supply growth, relative to their peer cities, likely have restrictive land use rules that make homebuilding difficult.
As data nerds who enjoy shaming NIMBY cities, we at Abundant Housing applied this finding to create our own “housing scorecard” for L.A. County.
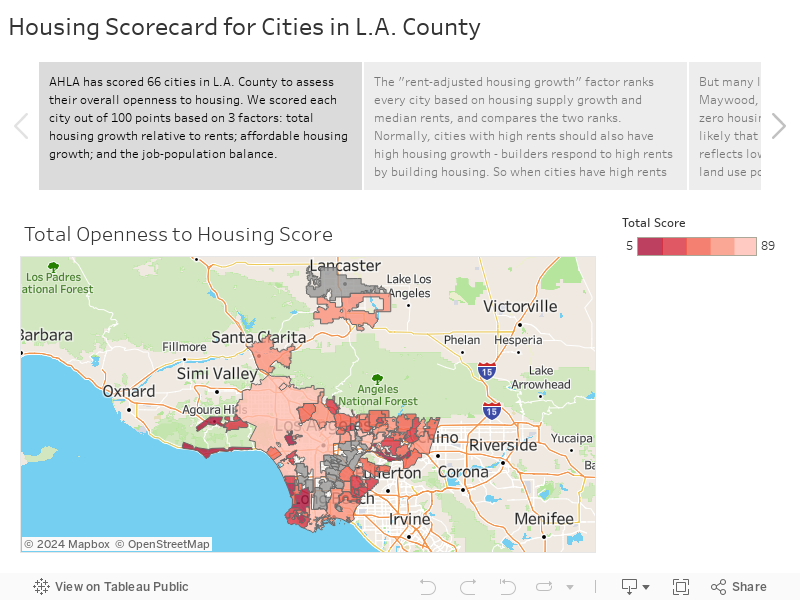
Our methodology scores cities out of 100 points, based on three factors:
First, we gave each city a “rent-adjusted housing growth” score, out of 50 points. Here, we ranked every city in L.A. County based on their median rent and recent change in housing supply, and comparing these two ranks. For example, Azusa’s housing supply grew 4% between 2015 and 2020, which ranked 5th highest in the county. Azusa’s median rent is $1,465/month, which ranked 52nd highest in the county. Under this methodology, since Azusa’s housing supply growth ranks very high and its median rent ranks in the bottom third, Azusa’s “rent-adjusted housing growth” score is the best in L.A. County.
Conversely, Malibu’s housing supply actually shrank 6.6% since 2015, which ranked worst in the county. (Granted, the 2019 Woolsey fire caused most of the net decrease in the city’s housing supply). Its median rent is $2,400/month, which ranked 6th highest in the county. So our methodology gives Malibu the worst “rent-adjusted housing growth” score in L.A. County.
Of course, “rent-adjusted housing growth” alone isn’t a perfect way to measure a city’s openness to new housing. One issue: cities with high poverty rates, like Maywood, Cudahy, and Commerce, usually have little housing growth and low median rents. The lack of housing growth in these cities may reflect low overall demand (which is itself a function of economic inequality, systemic racism, and public officials’ failure to adequately invest resources in these heavily Latino cities), rather than restrictive land use policies. It’s difficult to disaggregate those two possible explanations simply by comparing rent rank and housing growth rank.
For this reason, the authors of “Superintending Local Constraints” recommend excluding the lowest-rent cities from this type of analysis, since it’s not quite fair to compare these cities to the other cities in the region. That’s why our methodology only scores the 66 cities with the highest rents (omitting the bottom quartile).
Additionally, focusing on the total housing supply alone doesn’t capture the full picture. For example, the “rent-adjusted housing growth” factor says little about a city’s willingness to encourage affordable housing. The city of Monrovia’s housing supply grew 4% since 2015 (8th highest in the county), but permitted no new housing units that are affordable to lower-income households.
That’s why we added a second factor for affordable housing growth. We ranked each city by how much affordable housing they permitted between 2014 and 2019 (adjusted for the city’s population), and turned this into a score out of 25 points. Cities that approve relatively high amounts of affordable housing, like San Fernando (10 new affordable homes per 1,000 adults) and West Hollywood (5 new affordable homes per 1,000 adults), receive higher affordable housing scores. Of course, the competition isn’t exactly stiff – again, 38 cities permitted no new affordable housing over the past five years. All 38 receive an affordable housing score of 0/25 in our methodology.
Finally, we included a third factor for job-housing balance. Cities that host major job centers have an especially strong obligation to accommodate new housing, since building more homes near jobs improves access to economic opportunity and shortens commutes. We ranked each city by their ratio of jobs to total population, and created a score out of 25 points. Cities with a large imbalance between jobs and housing (lots of jobs; not enough homes) get a lower score. Unfortunately, many of our region’s job-rich cities, like Santa Monica, Beverly Hills, El Segundo, and Burbank all have large job-housing imbalances. In fact, they each have more jobs than residents, suggesting that they’re not doing enough to allow more of the city’s workers to live in the city.
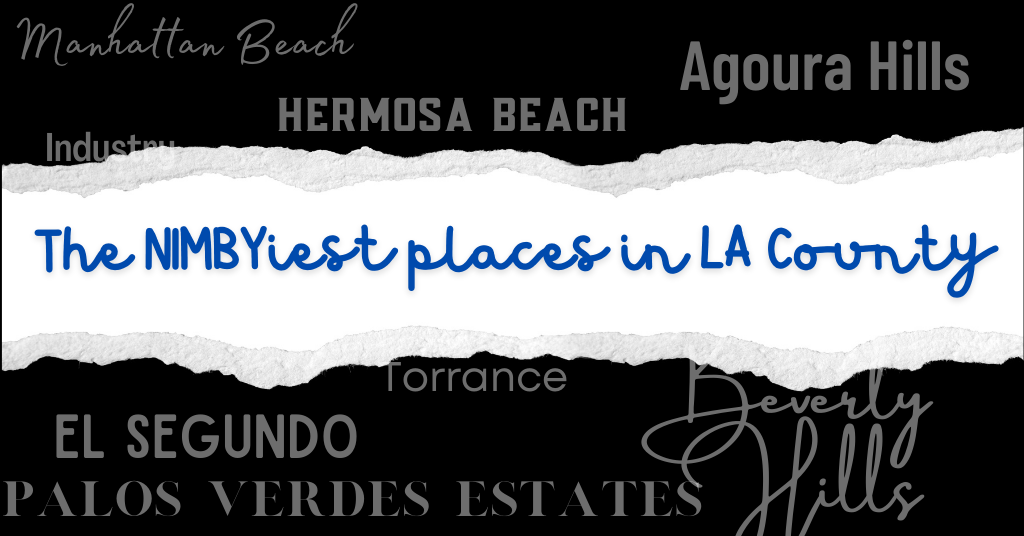
So which cities score the worst overall in our methodology? Our scorecard has a three-way tie between Malibu, Westlake Village, and Rolling Hills, each scoring only 5 out of 100 points. These are small, exclusive suburbs of Los Angeles, all of which have very high housing costs, as well as flat or negative growth in housing supply.
Also rounding out the ten NIMBY-est cities of L.A. County are Industry, Agoura Hills, Hermosa Beach, Beverly Hills, Torrance, Manhattan Beach, El Segundo, and Palos Verdes Estates (the latter two tied for 10th place, which is why we’ve listed 11 cities overall). With the exception of Industry, all are wealthy suburbs in West Los Angeles and the South Bay. These cities have low housing growth despite high rents, little to no new affordable housing, and a large imbalance of jobs to residents. You can take a closer look at how each city scored here.
Of course, if your city wasn’t in the bottom ten, there’s not exactly much cause for celebration. Our housing shortage and affordability crisis are region-wide, and every city government should be doing more to encourage denser housing growth near jobs and transit.
Fortunately, you have a golden opportunity to advocate for pro-housing policies in your city. Thanks to recent changes to state law, cities across California are in the process of updating their “housing elements” in order to achieve historically high housing growth targets. Cities have to complete these updates by October 15, 2021, so every day counts.
Abundant Housing LA is engaging with cities across L.A. County to make the case for a transformative housing element update, which will help to fix our housing crisis. If you want your city to lead the way on making housing abundant and affordable, join us!


