Anyone who’s ever been to a Los Angeles neighborhood council meeting knows that housing can be an emotionally charged issue. Understandably, people have very strong feelings about their homes and neighborhoods, and these feelings are usually guided by their personal experiences and observations. This is why, for example, some Angelenos are skeptical that Los Angeles even has a housing shortage. You’ll often hear statements like:
“There are plenty of new apartments in Los Angeles. Just look at all the cranes Downtown!”
“There are lots of apartments in my neighborhood.”
“Los Angeles is full.”
To effectively push back against these beliefs, pro-housing advocates need neighborhood-level data that explains Los Angeles’ housing crisis. The housing supply data that’s out there is typically not user-friendly, and it’s hard to blame people for not knowing the facts when the facts aren’t clear or accessible.
Fortunately, we at Abundant Housing LA have created the Los Angeles Housing Supply Atlas, an interactive map that brings neighborhood-level housing data to your fingertips. For every neighborhood in Los Angeles, we have information on:
- Total number of homes
- Housing density (the number of homes per square mile)
- Share of homes that are single-family
- Share of homes that are in apartment buildings
- Average home age
Check it out!
To create this atlas, we started with a massive dataset of every property in the county. The dataset comes from the Los Angeles County Assessor’s Office, and it looked something like this:
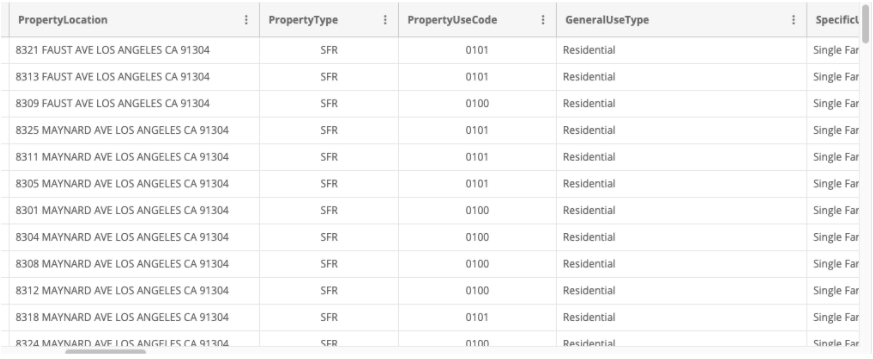
Using R, a software package for analyzing big datasets, we created the variables of interest and totaled them for each neighborhood. Then, we put them on an interactive map in Tableau, a data visualization software program. You can explore the atlas in more detail here, and if you want to experiment with the underlying data and code yourself, here’s a link.
The housing supply atlas helps us answer some important questions, like:
How many homes are there in Los Angeles?
The city of Los Angeles has just over 1.4 million housing units. Koreatown has the most homes of any neighborhood in L.A. with about 47,000, followed by Hollywood (40,000 homes), Westlake (40,000 homes), and Van Nuys (36,000 homes).
Where are homes concentrated?
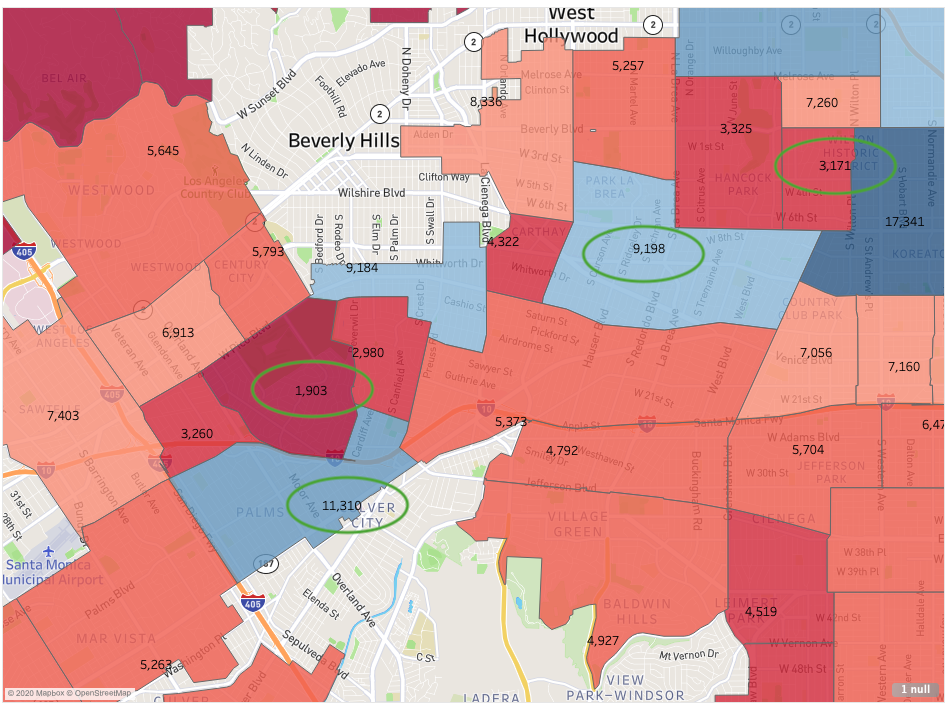
Of course, just counting housing units doesn’t provide a full picture. Woodland Hills has more homes than East Hollywood, but East Hollywood is much smaller in area. By calculating each neighborhood’s housing density (the number of housing units per square mile), we can see that housing density is generally concentrated in Central L.A., and that the Valley, South L.A., Eastside, and Westside are much less dense with homes.
Even within regions of the city, neighborhoods that border each other can have very different housing densities. For example, Palms, a Westside neighborhood, has 11,000 homes/sq mi, making it one of L.A.’s densest areas. Just to its north, Cheviot Hills has only 1,900 homes/sq mi. Similarly, Mid-Wilshire has over 9,000 homes/sq mi, but Windsor Square is about 3 times less dense with homes.
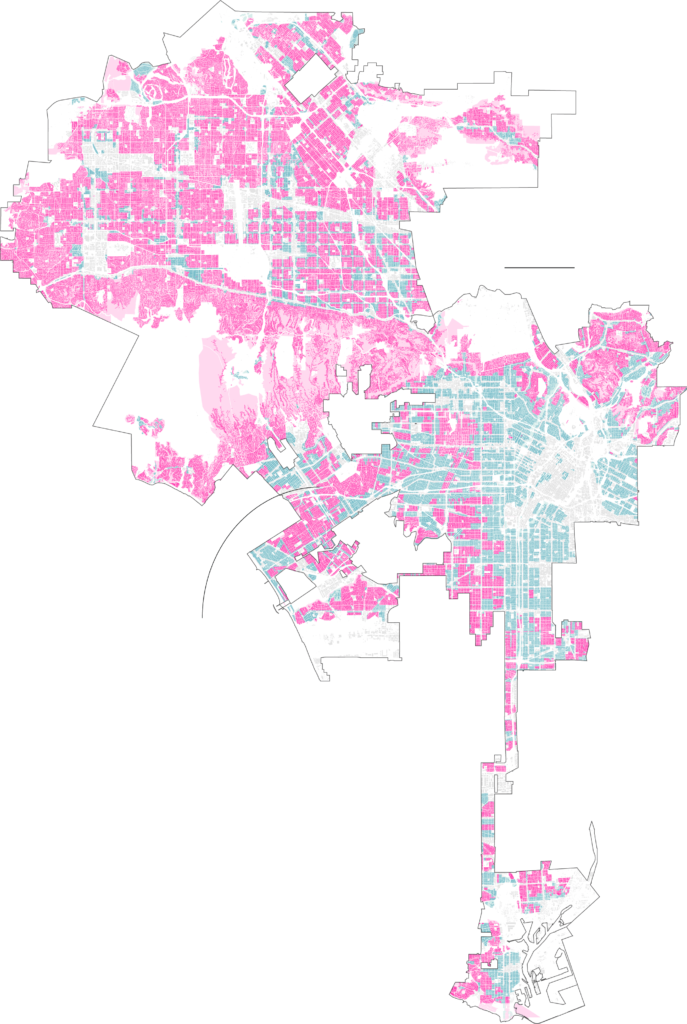
This is because of the zoning rules that govern residential construction, and often limit neighborhoods to single-family housing only. On about 75% of Los Angeles’ residential land, especially in the Valley and on the Westside, the only structure that can be legally built is a single-family home (the pink areas; multifamily homes are in blue).
This is why in most neighborhoods in the Valley and Westside (colored red and orange), single-family homes make up the majority of housing units, and why single-family homes are much less common in Central and East L.A (colored green).
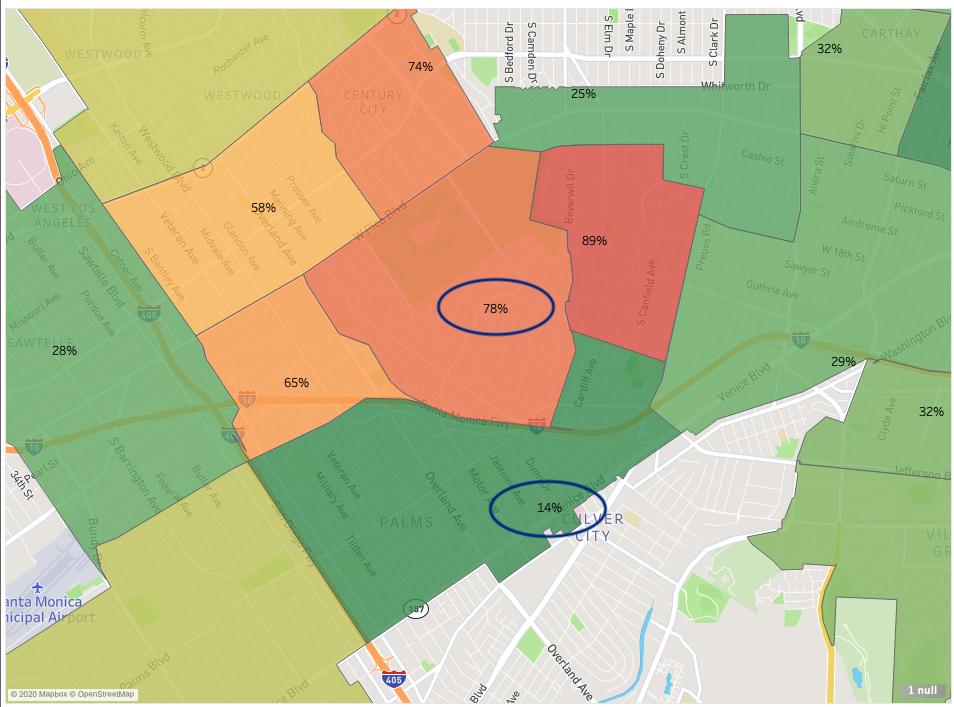
Zoning rules can be very different even for adjacent neighborhoods, which helps explain the housing density patterns discussed earlier. In Palms, where apartments are generally allowed, only 14% of the homes in Palms are single-family, but in Cheviot Hills, where most of the land is restricted to single-family development only, 78% of housing units are single-family.
Another way of observing this relationship is by identifying neighborhoods where apartment buildings (here defined as buildings with 5 or more housing units) make up a high percentage of the total housing stock. As you can see below, apartment buildings are common in the area between Downtown and Hollywood, in Palms and Sawtelle on the Westside, and in Van Nuys, Canoga Park, and North Hollywood in the Valley. Most neighborhoods in the Valley, Westside, and South L.A. have low concentrations of apartment buildings.
How old is L.A.’s housing stock? Where are new units typically found?
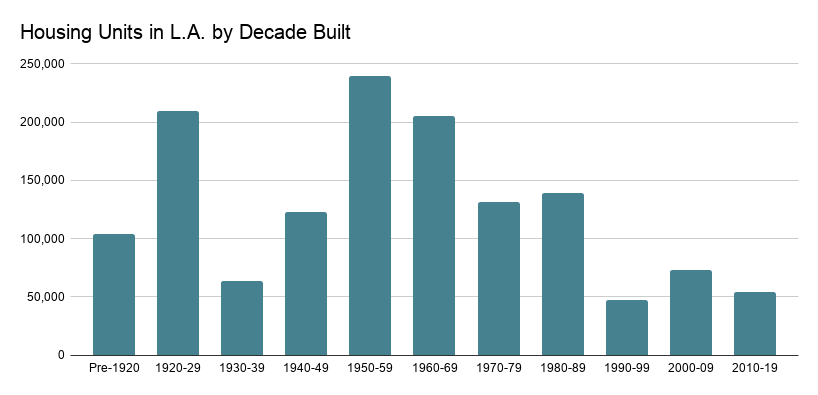
From 1970 onwards, the pace of new housing construction in L.A. slowed significantly. This is why just over half the homes that exist in Los Angeles today were built before 1960.
The average home in a Valley or Westside neighborhood is less than 60 years old, with older residential buildings concentrated in Central and East L.A. The oldest homes on average are in South L.A. neighborhoods and Boyle Heights (average home ages of 80-95 years are common). Downtown stands out from adjacent neighborhoods, with an average home age of only 42; this is because of the fast pace of new residential construction, as well as conversion and restoration of older buildings.
Outside of Downtown, Chinatown, and Playa Vista, no neighborhood has added a meaningful amount of housing within the last 20 years. And in South L.A., East L.A., Los Feliz, Silver Lake, and Echo Park, less than 20% of the housing stock was built within the last 50 years.
So to summarize:
- Los Angeles is not “full”. Single-family housing predominates in most of its neighborhoods, even in high-opportunity job corridors on the Westside where more housing is in very high demand. There’s a lot of space to build taller.
- Only a few of its neighborhoods, mainly in Central L.A. and Downtown, have a dense concentration of housing. These are the neighborhoods where apartment buildings are generally allowed.
- Los Angeles has built relatively little housing over the past 50 years. Outside of Downtown, the Westside, and the Valley, the average home in most neighborhoods is 65 to 95 years old, with high-poverty neighborhoods in South and East L.A. having the oldest average home age.
Now that we understand existing housing in L.A.’s neighborhoods better, how can we use this information to plan for a future with much more housing? Well, we’ve got some plans for that. And how do we address affordability? We’ve got some plans for that also.


